

- Debugging needs to be explicitly enabled.
- All debugging events are stored only temporarily so you can inspect and debug potential issues, then all the data is deleted automatically.
- Debugging only applies to a single user at a time (yourself), not every visitor on your website; this keeps things efficient and lets you inspect exactly the events you need without being flooded with thousands of events from everyone else.
Enable debugging for your project
After you’ve activated at least one data collection component, a new Debug button will appear on your project’s Components panel.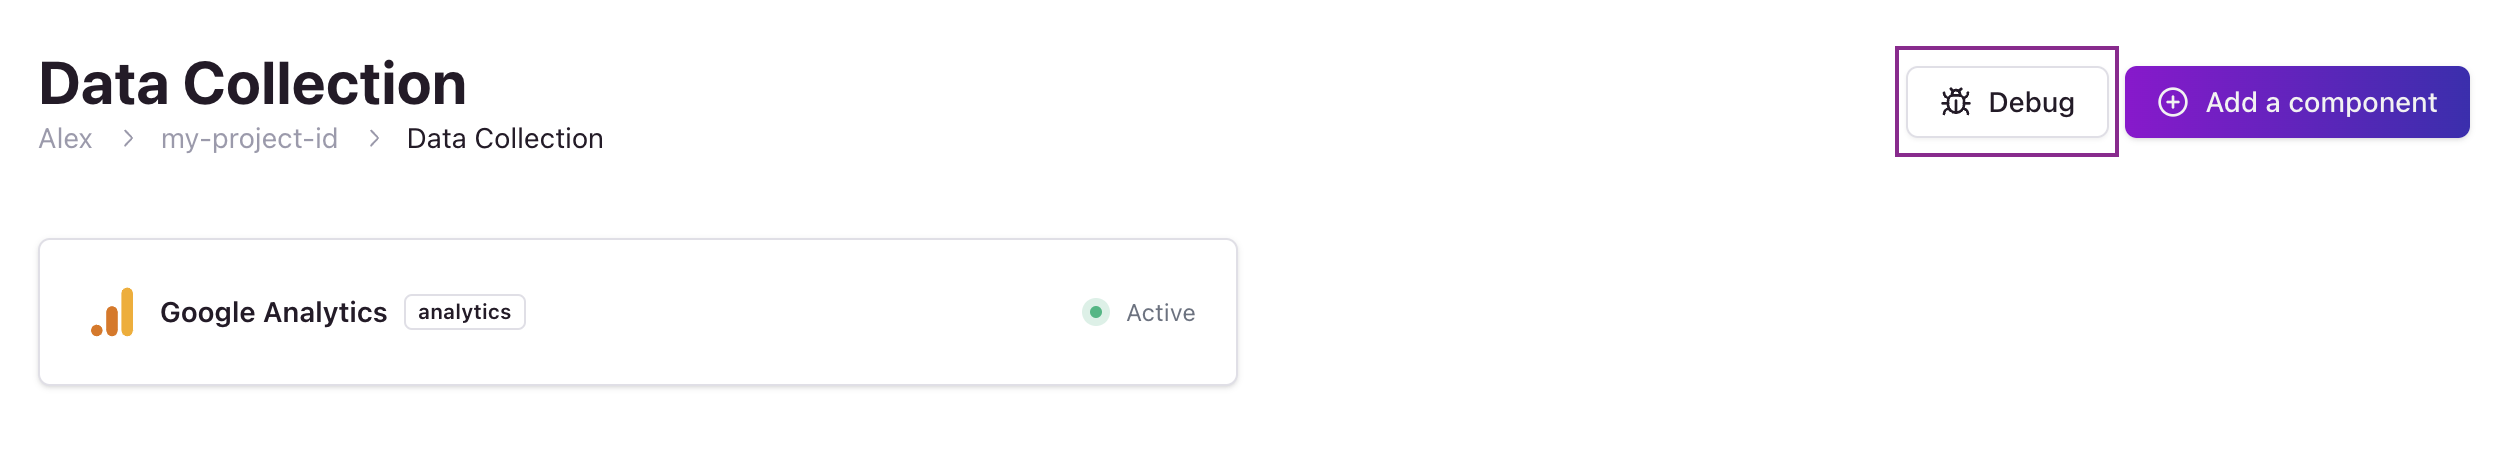
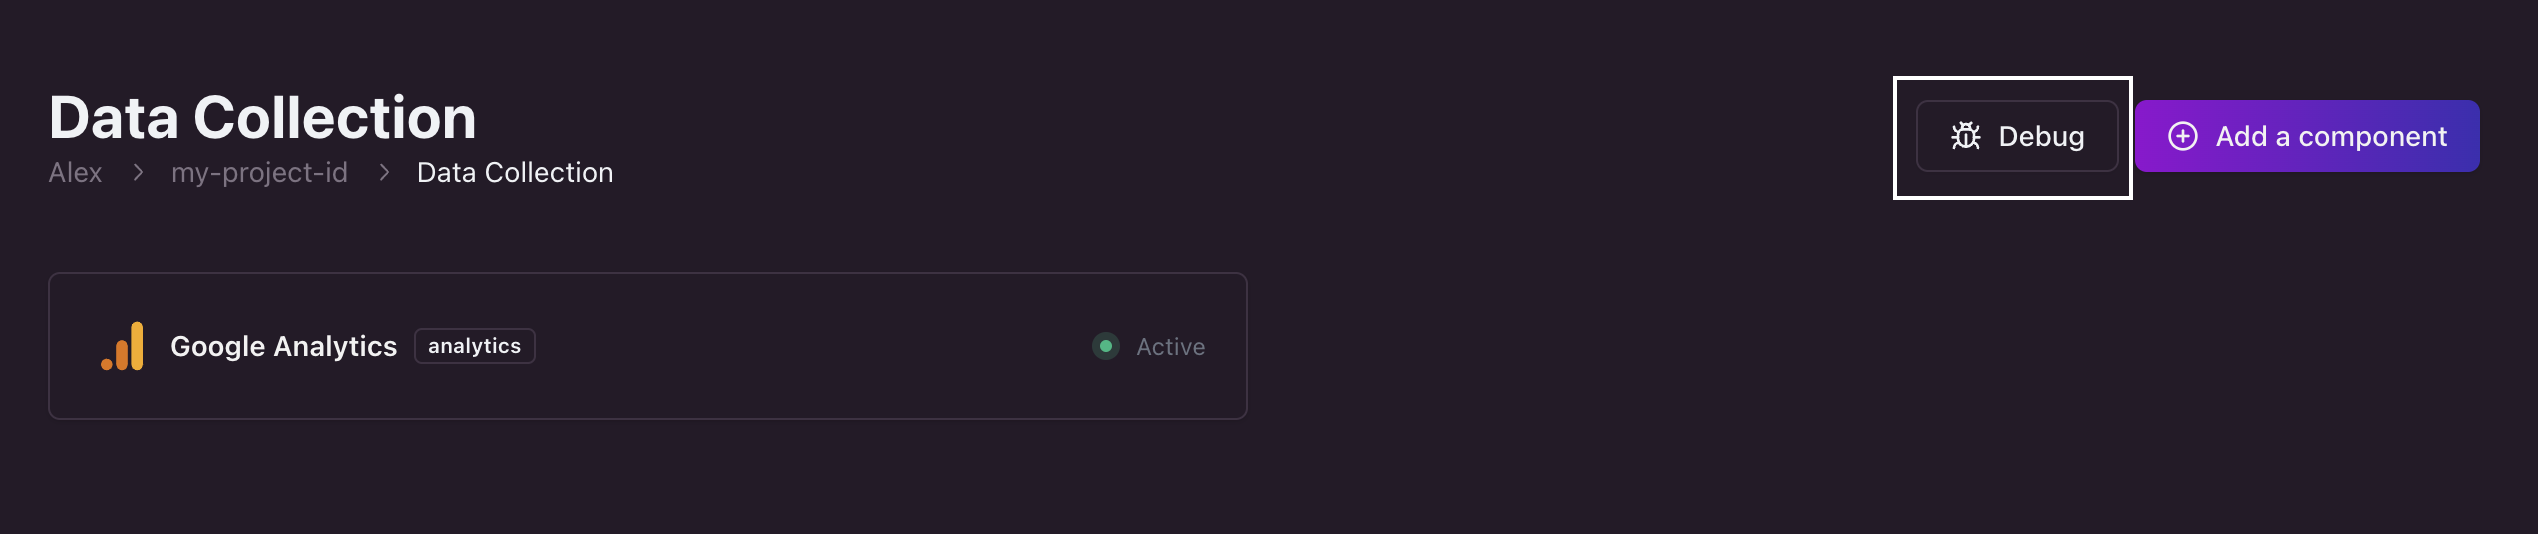
Where to find the debugging page for your project. Click on the image to zoom in.
?_edgeedebug=true in query string.
No worries, you will find a direct link to your project’s homepage with that special query string already configured.
Something like https://your-project-id.edgee.app?_edgeedebug=true.
Please note that:
- This only works if you visit a page where the Edgee SDK is correctly installed. In the rare case where the Edgee SDK is not installed on your homepage, please visit another page with the same query string.
- This will enable the collection of debugging events only for yourself (not for all the users browsing your website). If you need a complete overview of how many events are being collected on your website in total, check out your project statistics.
Inspect debugging events
As you start browing on your Edgee-powered website with enabled debugging, new events will start to appear on this page. Click on each event to open and review its details, so you can inspect the corresponding data and context.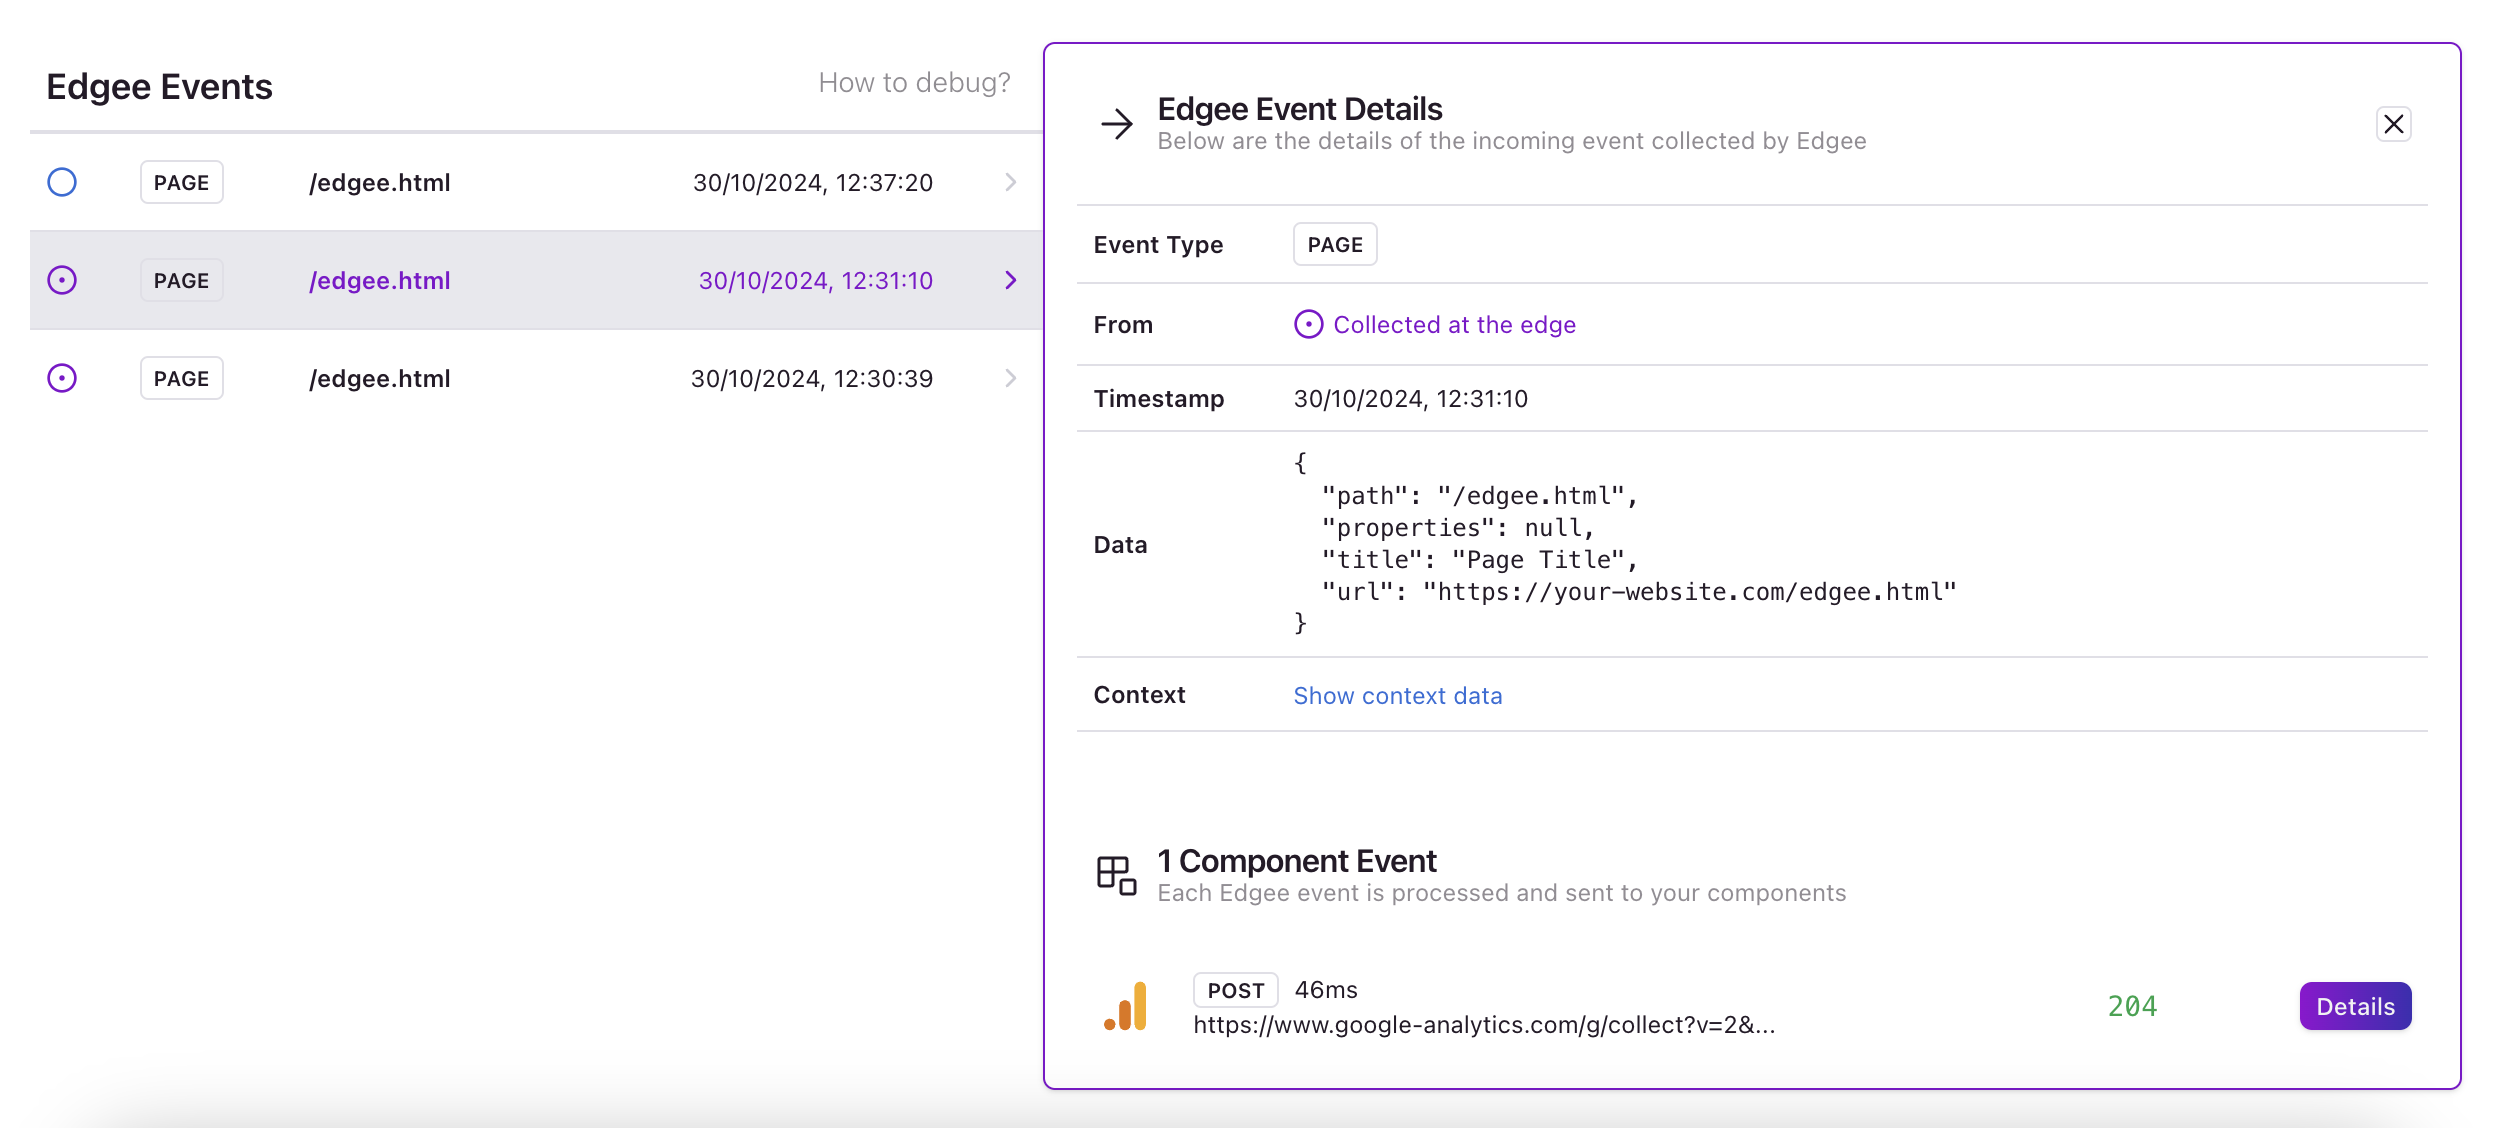
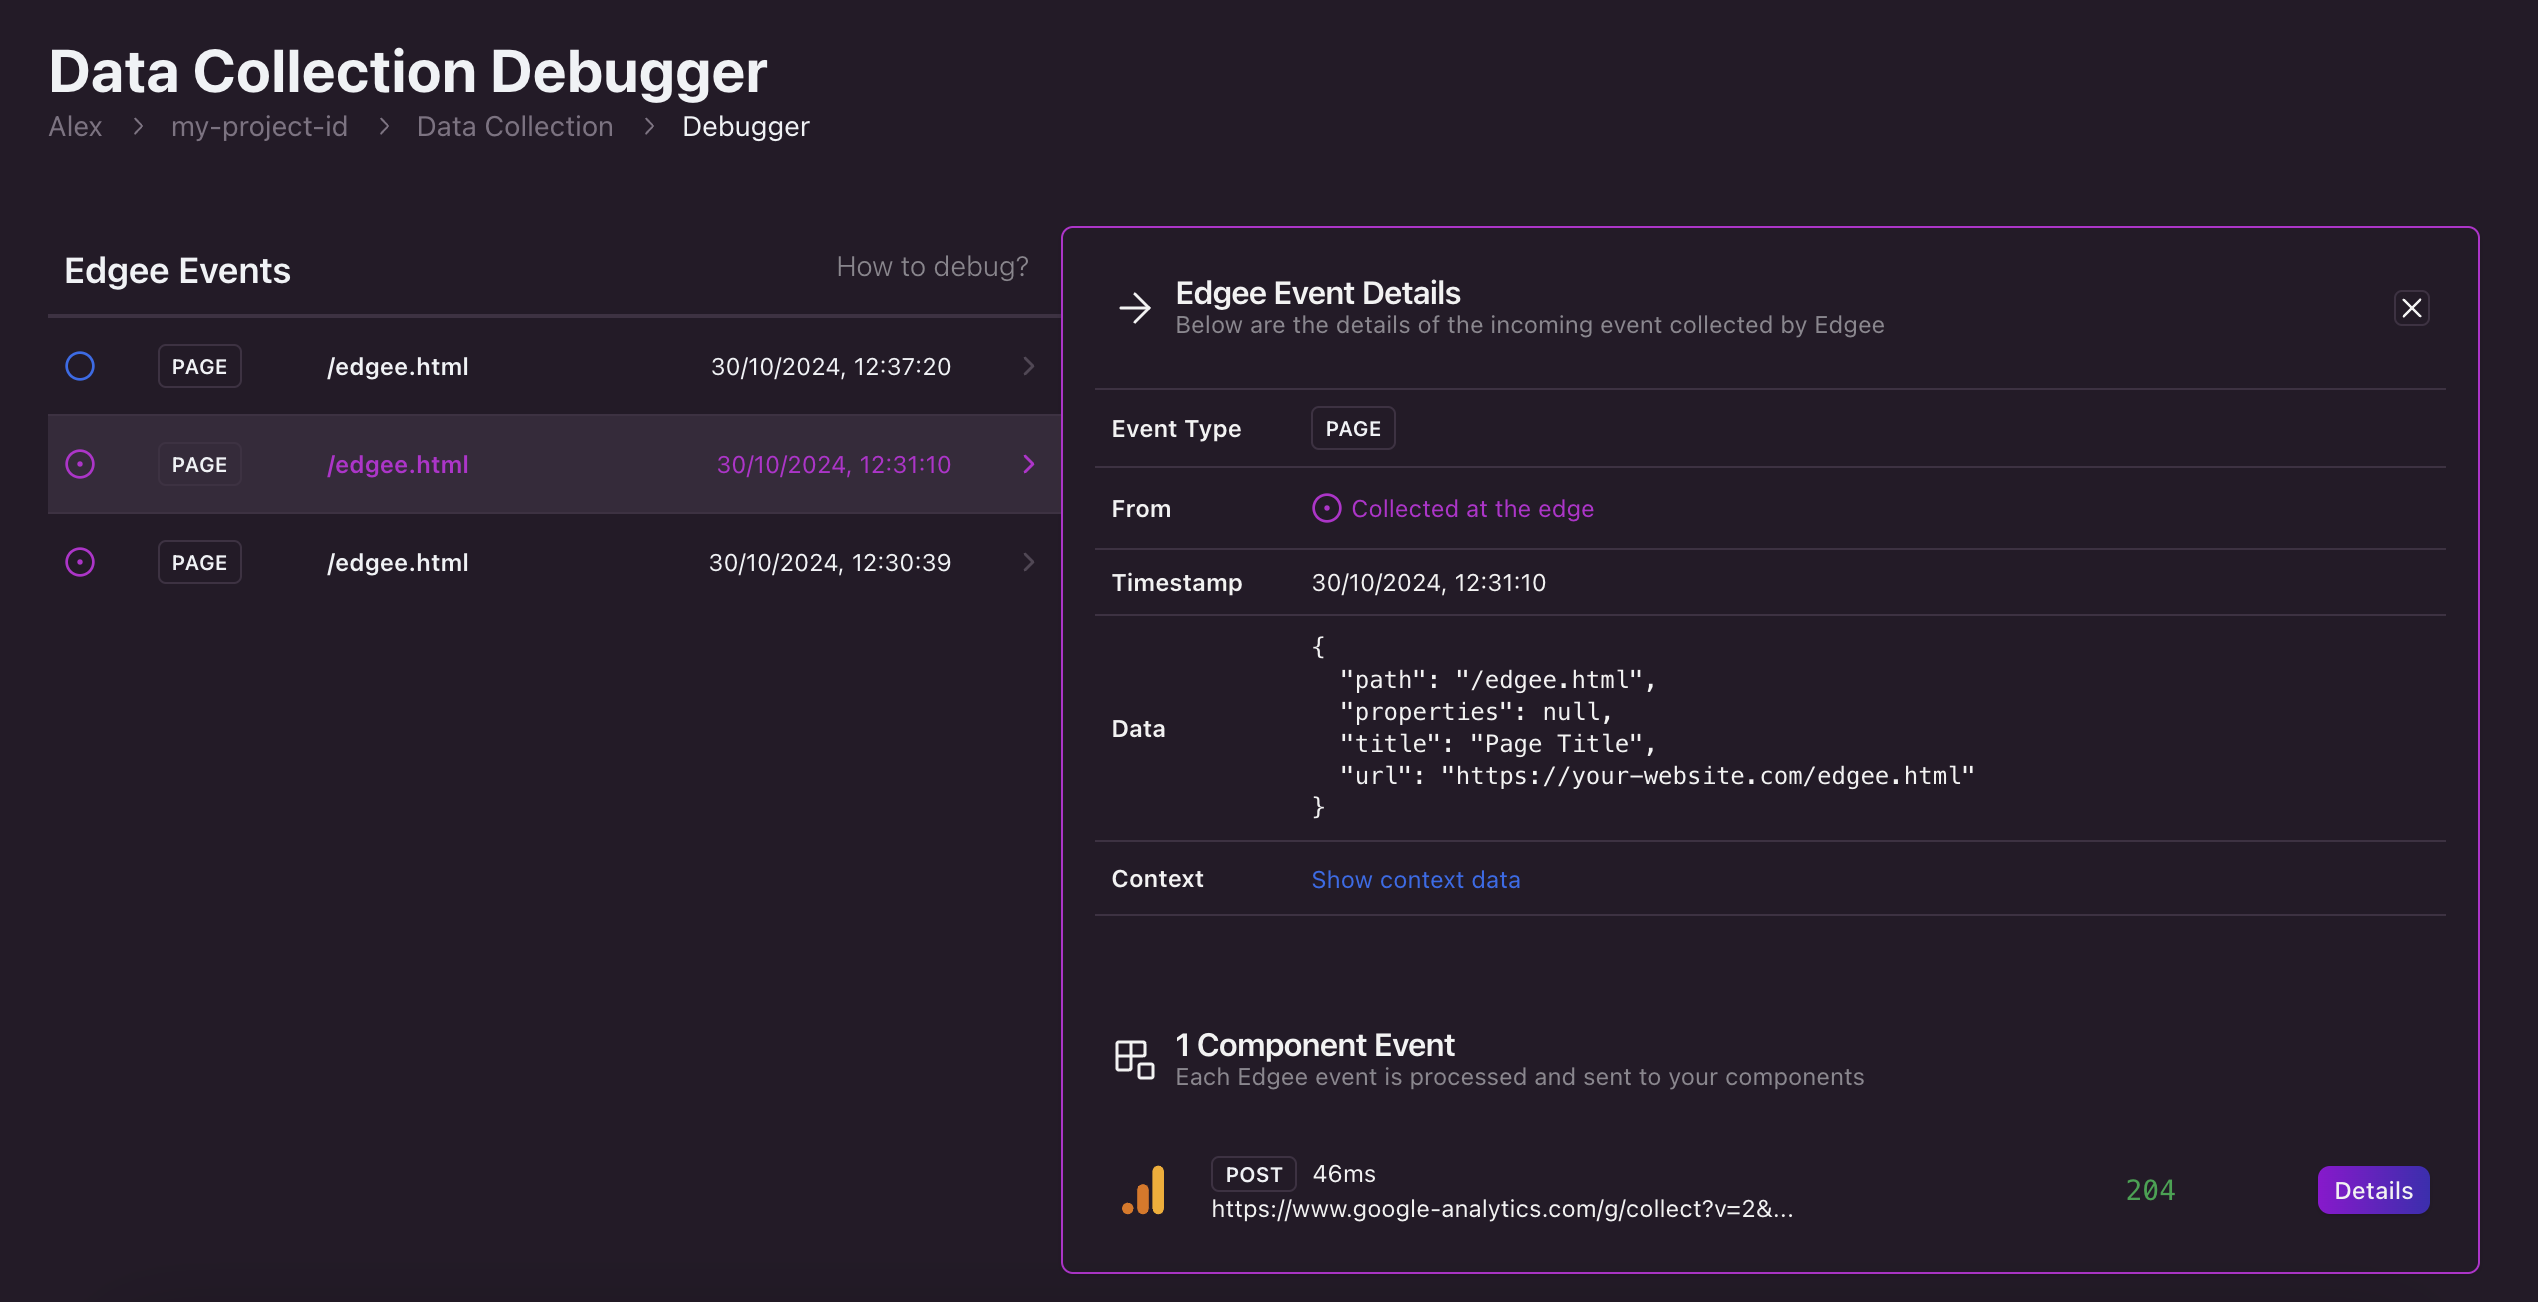
How to inspect debugging events. Click on the image to zoom in.
Note: these URLs might contain sensitive data about your analytics tools and integrations such as
Measurement IDs or API keys. We recommend sharing links or screenshots only with your dev team and trusted partners.